Which California County Has the Highest STD Rates? (It’s SF)
And Who’s Responsible? (It’s the men)
Yesterday, I stumbled across a dataset of California STD rates from 2001 until a couple of years ago…and..well…this article pretty much wrote itself.
As a responsible social scientist, I obviously had to lay out my hypothesis before conducting my data work because that’s what responsible social scientists do when they’re pretending to be real scientists.
My hypothesis: SF or LA is probably the highest.
My reasoning: Both of these counties contain a large city that TONS of young people move to from outside the area. These more lively social scenes are probably correlated with higher rates of “unsafe” decision-making on the weekends.
With that all squared away, the next step was to take a peek and see what the data had to say. Which county in California is the STD king? Each one of these lines represents a county. So, whichever line is highest, wins.
DING! DING! DING! We have a winner!
San Francisco County was, in fact, the winner in both categories. Nobody else, including LA, was even close. SF’s chlamydia rates (the first graph) were previously pretty normal, but have exploded in recent years. Meanwhile, their gonorrhea rates (the second graph) have always been elite, but recently they have taken it to another level. SF seems to be on a level of its own when it comes to STDs.
Why is this happening?
The natural question is, “What the hell is happening in SF?”
And while I can’t entirely answer that question, the data is pretty telling.
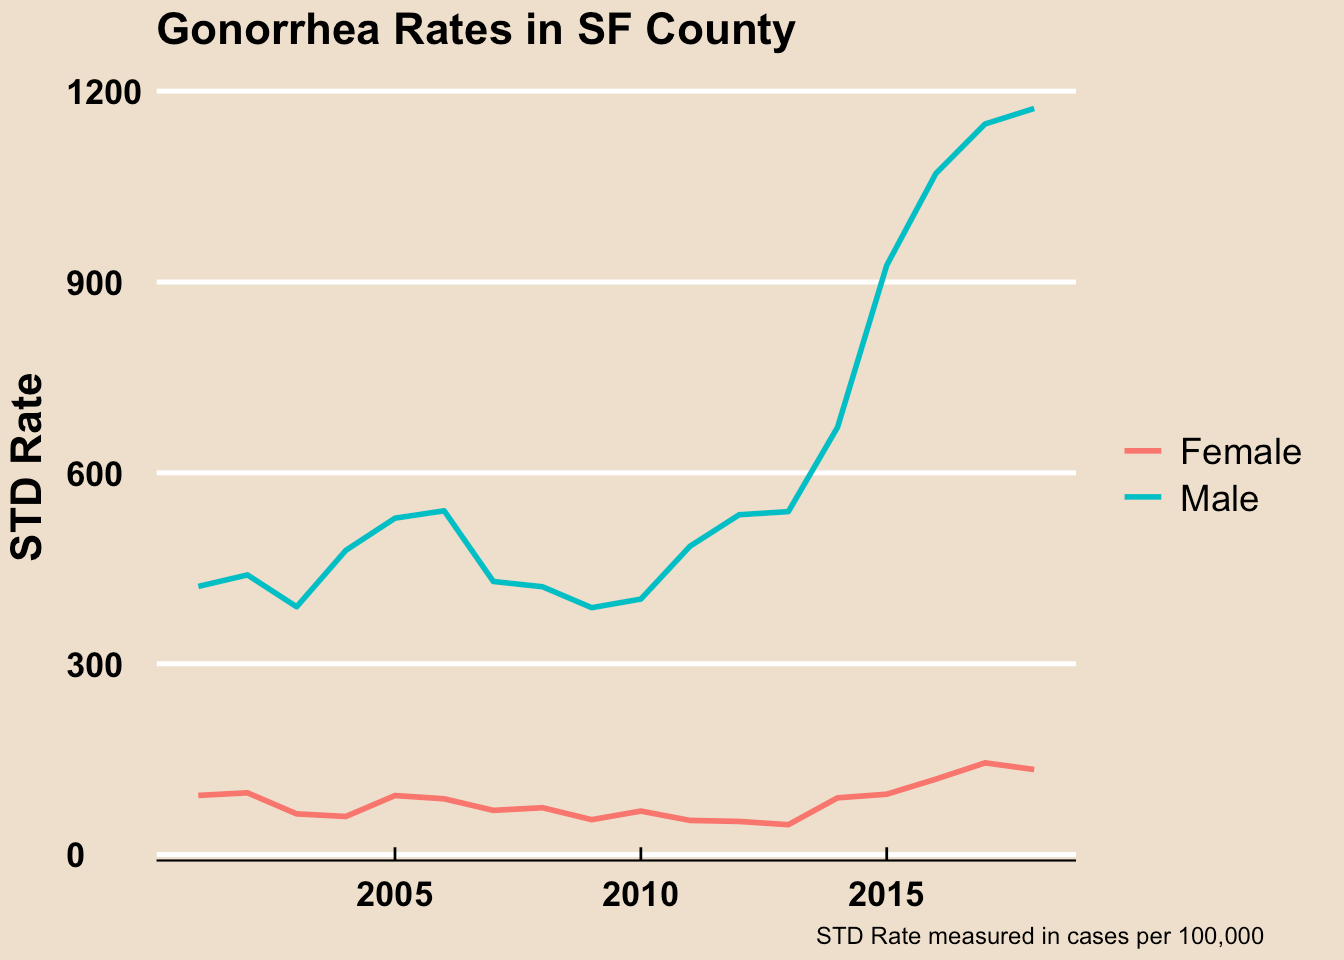
The dataset also contains STD rates for males and females in each county. And when we look at San Francisco’s STD rates for males and females separately, a pretty clear pattern emerges.
The male rates are SKYROCKETING, while the female rates are not moving very much. There are really only two possible explanations for this: 1) the very sizable male gay community in SF has a growing STD problem or 2) somehow a ton of heterosexual men are being “unsafe” with a small group of infected heterosexual women and not spreading the disease to the rest of the women. There might be some truth to both of these, but given how sharp the contrast is between the males and females, the smart money says it’s mostly the gay community—but not necessarily entirely.
This huge growth in STD rates reflects a California-wide trend. STD rates are growing everywhere, but nothing like in San Francisco. The next chart shows the STD rates of San Francisco County vs. the average of the rest of California’s Counties.
I used 49ers colors.
In recent years, SF has literally blown the roof off of the chart. They have made what would have been a seemingly large growth rate in the rest of the state appear tiny in comparison to their own growth.
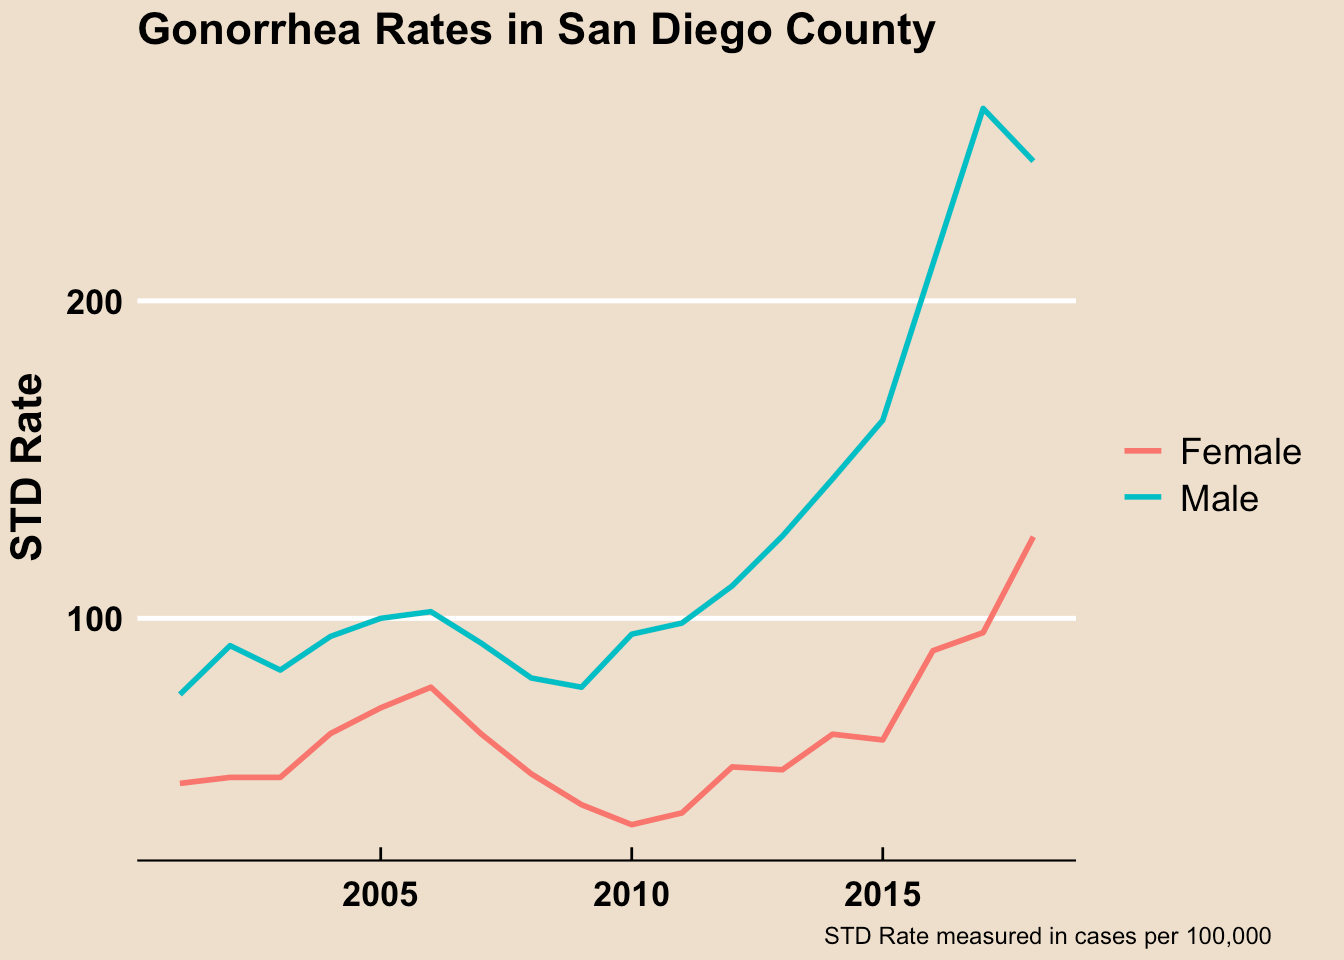
I’m not exaggerating. Look at these STD growth rates for San Diego County.
That is MAJOR growth.
But San Diego’s “Yeah bro, we’re just having a good time down here” growth is barely even noticeable when you compare it to what the flower children up North have been up to.
Also, these parallel-looking lines between the male and female STD rates for San Diego are what you would expect to see if the heterosexual community was mostly responsible for STD growth. You’d expect to find the lines rising and falling together because you’d need one male and one female, usually, to spread the disease between straight partners.
It is likely that the straight community in SF is experiencing this same kind of moderate growth that you’re seeing in San Diego (and everywhere else). We can test this by seeing if the SF female population has STD rates similar to San Diego.
It looks like it does. That means that the straight community in SF has a growing STD problem as well. But, their STD rates seem to be on par with those of the rest of the state. Essentially, the straight community in SF seems to be “regular bad” at spreading STDs. Meanwhile, the SF male gay community seems to be “super bad.” The Bay might have a growing public health problem on its hands.
The good news is that neither of these STDs tends to be life-threatening or affect one’s health in a serious way. But ‘the clap’ is inconvenient, to say the least.
This is not at all an indictment of SF’s gay community. From the looks of these charts, it seems like the entire state (and likely the entire country) needs to be doing a better job of making responsible decisions. Not to mention, many might posit that a lot of the better decision-making being made in the straight community is not exactly driven by the men.
This data was only as recent as 2018, so maybe this trend has fixed itself in the meantime…but I highly doubt that.
Do with this information what you will. I’m not a doctor. I just do this for fun.
Stay safe, wrap up, and subscribe for more odd content.
* It should be noted that there is some chance that gay men in SF just get tested way more frequently than anybody anywhere else and they are just finding more STDs in this community because they get tested so much more often than anyone else. If this is the case, it likely would diminish the rate to some extent, but probably not enough to put its growth rate on par with the female population.


